Vision Zero
  • Home
  • Demonstration Projects
  • Get Involved
  • Data and Documents
  • Home
  • Demonstration Projects
  • Get Involved
  • Data and Documents
Search by typing & pressing enter

YOUR CART

Demonstration Projects Show Vision Zero
​in Action


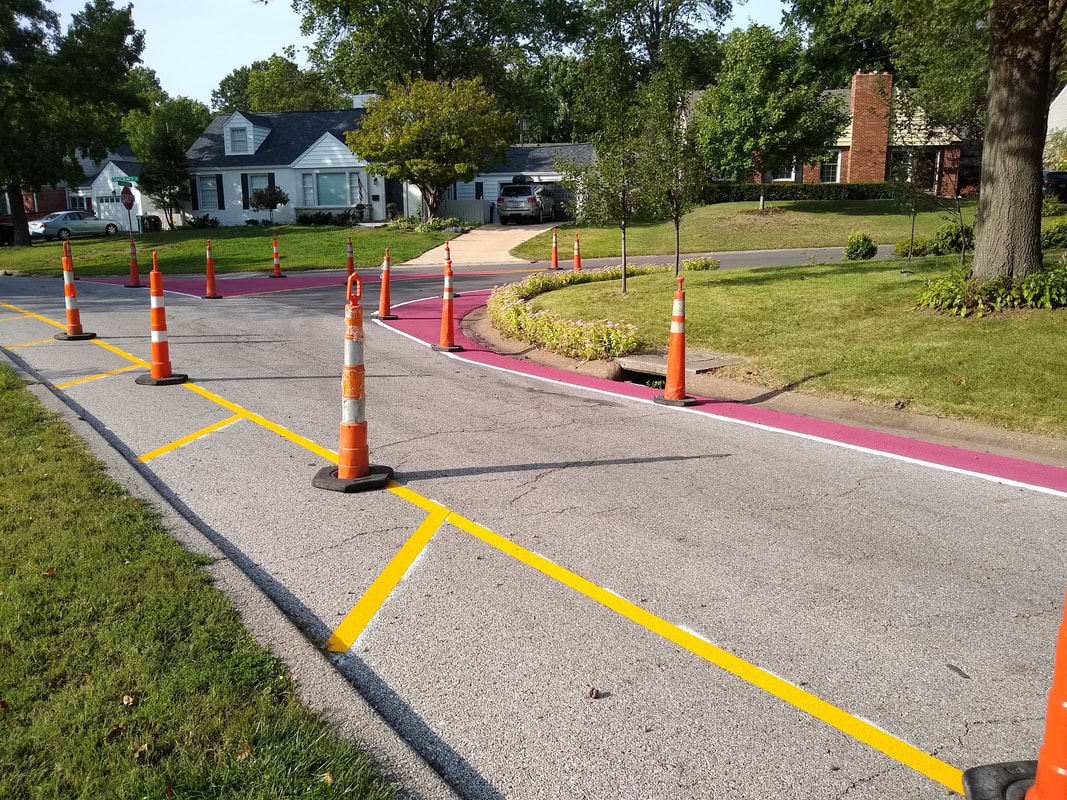
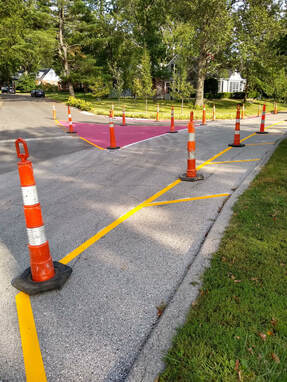
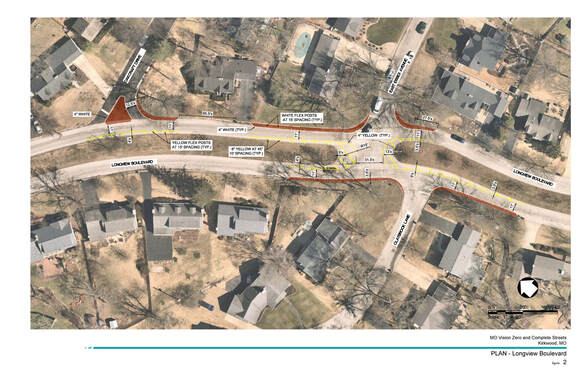
As Vision Zero planning takes place, demonstration projects will be used to test potential solutions and provide residents hands-on (or feet or wheels on) ways to experience safety improvements. The projects are intended to generate public awareness and conversation and inform guidelines and design for the City to use moving forward.

Three demonstration projects will be tested during the Vision Zero planning process.   Sites will be selected with several factors in mind including:
  • ability to test a variety of treatments in different types of roadway conditions, 
  • history of neighborhood concerns relayed to the city regarding roadway safety, and
  • high incidents of crashes.

Demonstration Project #1:  Longview Boulevard

Picture
Picture
Location:  Longview Boulevard between Oakcraft Drive and Claybrook Lane
​Duration: September 20-October 8

Temporary Improvements  
Lane delineation, curb extensions, and a median island at Oakcraft Drive aimed at making driving, walking, and biking safer along the corridor.

Public Input Needed
Walk, drive, and bike the demonstration project and tell us about your experience using the comment form below.


​Evaluation:  what is the impact?

To evaluate the impact of the temporary installation, travel speeds before the demonstration project will be compared to travel speeds during the demonstration project.

Traffic Speed Before the Demonstration Project
The two reports below are automatically generated by the City 's speed monitoring equipment and captured seven days of data prior to the installation of the demonstration project. One report provides numbers for the east-bound lane and the other report is for the west-bound lane. During this time period, the average speed for all classified vehicles was 26 MPH eastbound and 28 MPH westbound.
​

Pre-Demonstration Travel Speed, Eastbound
Pre-Demonstration Travel Speed, Westbound
​
Traffic Speed During the Demonstration Project:  Week 1
The two reports below capture the first seven days of the demonstration project recorded by the City's speed monitoring equipment from September 20 to September 27. During this time period, the average speed for all classified vehicles was 22 MPH eastbound and 21 MPH westbound.


Demonstration (Week 1) Travel Speed, Eastbound
Demonstration (Week 1) Travel Speed, Westbound


Traffic Speed During the Demonstration Project:  Week 2
The two reports below capture the second week of the demonstration project recorded by the City's speed monitoring equipment from September 30 to October 7. During this time period, the average speed for all classified vehicles was 25 MPH eastbound and 23 MPH westbound.

Demonstration (Week 2) Travel Speed, Eastbound
Demonstration (Week 2) Travel Speed, Westbound


Picture
Powered by Create your own unique website with customizable templates.